
Universities’ first time adjustment for new standard
Australian universities adopted accounting standard AASB 9 Financial Instruments for the first time in their 31 December 2018 financial reporting. AASB 9 replaced AASB 139 Financial Instruments: Recognition and Measurement for reporting periods beginning on or after 1 January 2018.
The new standard changes the classification and measurement of financial assets and requires the earlier recognition of provisions for bad and doubtful debts based on expected credit losses. The effects of adopting AASB 9 were recognised as an adjustment directly to retained earnings at 1 January 2018.
Our audit testing confirmed the accuracy of the following adjustments reported by the four universities. The table below outlines the nature and effect for each university in adopting AASB 9.
| University | Nature of adjustment for implementation of AASB 9 | Financial effect |
| Curtin | Reclassification of available for sale financial assets to fair value through profit or loss
Reclassification of available for sale financial asset reserve to retained earnings |
$28.4 million
$61.8 million
|
| ECU | Reclassification of available for sale financial assets to fair value through ‘other comprehensive income’
Initial recognition of equity investment in non-listed companies |
$4.1 million
$5.6 million |
| Murdoch | Reclassification of available for sale financial assets to fair value through profit or loss
Initial recognition of equity investment in non-listed companies |
$21.2 million
$5.6 million |
| UWA | Reclassification of available for sale financial assets to fair value through profit or loss
Initial recognition of equity investment in non-listed companies Reclassification of available for sale financial asset reserve to retained earnings |
$17.2 million
$5.6 million $16.2 million |
Table 2: Nature and effect on universities of adopting AASB 9
Selected significant financial transactions
Details of significant 2018 financial transactions that we noted during our audits are listed under subheadings below. Most of this information is reported in each university’s annual report. By reporting these items, we are not implying that we have any residual concern with these transactions.
Assets
- Each universities’ investment in Education Australia Limited increased from $16.2 million in 2017 to $22.9 million following the most recent independent fair value assessment conducted in 2018. Also, as a result of the initial application of Australian Accounting Standard AASB 9, an equity interest held by the universities in AARNet Pty Ltd had an initial 2018 valuation of $5.6 million. At year end, the fair value was $5.9 million for each university.
- ECU purchased land within Joondalup’s Quadrangle Estate for $8.7 million from Western Australian Land Corporation (Landcorp) in 2018 to accommodate further expansion opportunities.
- During 2018 ECU acquired all of the issued share capital of St Stephen’s College in two transactions totalling $3.1 million. The college is a provider of English and business education in China for high school students as a pathway to tertiary study in Australia.
- The University of Western Australia’s property, plant and equipment increased to $1.33 billion as a result of the $23 million capital investment in Ezone, a new student hub for engineering and mathematical science students.
- Curtin received $70 million of grant funding from the Commonwealth to upgrade the Pawsey Supercomputing Centre. Curtin was nominated by the Pawsey management board, which is comprised of CSIRO, Curtin, Murdoch University, ECU and UWA, as the most appropriate member organisation to receive the grant.
Liabilities
- Curtin’s current borrowings decreased by 60% ($21 million) mainly due to the final repayment of two Western Australian Treasury Corporation loans for Bentley Campus ($17 million) and Muresk Campus ($2 million) which matured during the year.
Revenue
- Murdoch University’s fees and charges increased by 26% or $19.9 million to $95.8 million in 2018. Murdoch attributed this to strong growth in onshore international student enrolments as a result of their International Welcome Scholarship and recruitment activities in targeted overseas countries.
- UWA’s donation income was $17.1 million in 2018 compared to $49.3 million in 2017 when a $33.5 million donation was received for the Forrest Research Foundation.
Key financial ratios of universities
The Australian Government Department of Education and Training (DET) uses a number of benchmark indicators to assess the financial performance of universities. These measures include liquidity, diversity of revenue, dependence on international student fees, operating result and borrowings to equity ratio.
We have used each university’s audited financial statements[2] to show performance against these indicators for the 5 years ending 31 December 2018. Table 3 summarises the risk ratings inferred by these indicators.

Liquidity / current ratio
The liquidity or current ratio assesses an entity’s ability to meet their debts as and when they fall due. The traditional accounting formula is current assets divided by current liabilities.
DET considers a ratio of more than 1 is low risk and below 0.75 to be high risk. Based on this rating, 3 universities were low risk, while UWA was high risk when assessed on this indicator for 2018.

As the liquidity ratio recognises current assets only, we have also shown in Table 5, details of the universities’ total current and non-current cash and other financial assets for each year. Each university’s liquidity ratio would improve if their non-current liquid assets were included in the calculation.

Diversity of revenue – dependence on Australian Government funding
Universities can reduce their financial risk by diversifying their revenue sources. Each university has a different capacity to generate revenue, depending on factors such as location, size, courses offered, extent of research activity, perceived standing and student profiles.
DET considers universities with 55% or less of revenue received from Australian Government funding a low risk and between 55 and 65% to be medium risk. Australian Government financial assistance includes Commonwealth Grants Scheme and other grants, HECS-HELP and FEE-HELP payments. For 2018, Murdoch and UWA rated as low risk while Curtin and ECU were a medium risk for this indicator.

Operating result
Universities are not-for-profit organisations but their operating result is a useful measure of financial performance. Large deficits or a trend of consecutive deficits indicates a need for review and analysis.
All universities reported a surplus for 2018.

Borrowings to equity ratio
Legislation permits universities to finance their activities by borrowing. DET considers universities with 7% or less of their equity represented by borrowings to be low risk. Greater than 10% rates as high risk.
Curtin and Murdoch remain low risk, while ECU and UWA rate medium risk on this indicator.

Dependence on overseas student fees
Universities can diversify their revenue sources by encouraging overseas students to study their courses. However, the general view is that universities should not be overly dependent on this source of income.
DET considers universities with 15% or less of operating revenue from fee‑paying overseas students to be low risk and between 15 and 25% to be medium risk. Based on these criteria, all four universities rate as medium risk for this indicator.

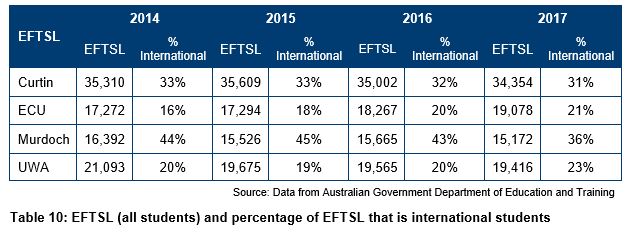
The proportion of university student enrolments relating to international students for each university for 2014 to 2017 ranged from 16% to 44%, as shown below in Table 10.
Equivalent Full Time Student Load for universities
Universities measure their student enrolments as Equivalent Full Time Student Load (EFTSL). As this information is released by the DET in September of the following year, the 2018 student enrolment information is not yet available.
The following table shows the EFTSL for the universities from 2014 to 2017, and the percentage of these enrolments relating to international students. ECU’s EFTSL has increased each year, as has their proportion of international students. The other 3 universities have an overall decreasing trend in their EFTSL with Curtin and Murdoch’s proportion of international students also decreasing.
[2] Financial ratios are calculated using the university figures, not their consolidated results.