
Introduction
The Annual Report on State Finances (ARSF) reports on the State’s annual financial results and financial position and explains significant variations from the prior year and from the annual budget estimates. Treasury prepares the ARSF and we audit key aspects under the Government Financial Responsibility Act 2000.
The ARSF brings together key financial information for the 3 sectors of government as shown in Figure 6. In addition to this consolidated financial reporting, each entity also prepares and tables its own annual report that provides detail of its individual finances.
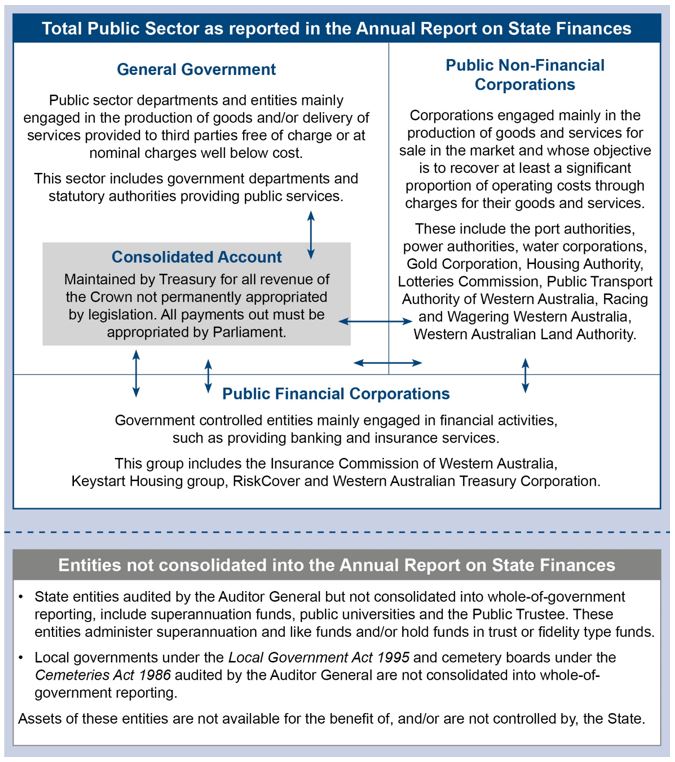
Figure 6: Financial relationships between sectors of Western Australian government
Audit opinion
We issued a clear (unqualified) audit opinion to the Treasurer on 20 September 2019. The audited ARSF was released by the Treasurer on 27 September 2019, meeting the statutory reporting deadline of 90 days after the end of the financial year, being 28 September 2019.
Timeliness
Timely and efficient preparation of the ARSF by Treasury and its audit by us is dependent on entities submitting accurate year end financial balances to Treasury on time.
This year 23 entities submitted June actual financial data to Treasury after the deadline of 25 July, compared to 36 late submitters last year. Late submissions reduce the time for Treasury to review entities’ balances and increases the risk of undetected errors.
Western Australia’s finances – selected key indicators
This section of our report provides information that supplements information contained in the ARSF that Parliament and other readers might find useful:
- net operating balance for General Government and for the Total Public Sector
- infrastructure renewal ratio
- borrowings and unfunded superannuation
- debt sustainability
- total borrowings and expense commitments
- current trend in leave liability balances.
Net operating balance
Figure 7 shows the net operating balance for the General Government sector and the Total Public Sector. A large number of factors affect the result, including economic circumstances, the performance of the State’s main industries, interest rates, Commonwealth funding and legislation. However, a surplus is generally an indicator of sound financial management and/or good budgeting.

Source: Tabled Annual Report on State Finances
Figure 7: Net operating balance from 2008-09 to 2018-19
Infrastructure renewal
Governments face an ongoing challenge to maintain existing infrastructure and also develop and provide new assets to achieve desired social, economic and environmental outcomes.
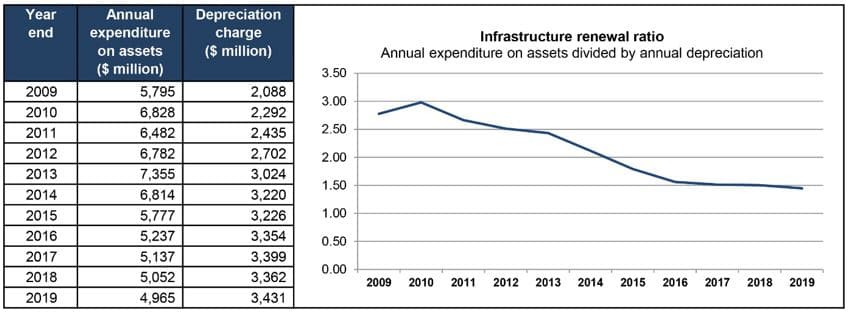
The infrastructure renewal ratio is an indicator of the rate at which existing infrastructure is being replaced and increased compared with the rate at which it is being used up. The ratio compares the annual expenditure on assets with the annual depreciation charge on assets. A ratio higher than 1.00 indicates that overall the State’s infrastructure is increasing.
Infrastructure assets mainly include land, roads, ports, water and electricity assets and networks, hospitals and schools. These represent almost the entire balance of non-financial assets. In 2018-19 the value of non-financial assets for the total public sector decreased slightly, from $153.5 billion to $153.0 billion.
Figure 8 indicates that although infrastructure renewal is slowing, it remains above the ratio of 1.00.
The infrastructure renewal rate is a high level indicator and caution is needed when interpreting the results. For example, this indicator does not inform on the extent to which maintenance of existing assets is prolonging their useful life.
Source: Tabled Annual Report on State Finances
Figure 8: Infrastructure renewal ratios from 2008-09 to 2018-19
Borrowings and unfunded superannuation
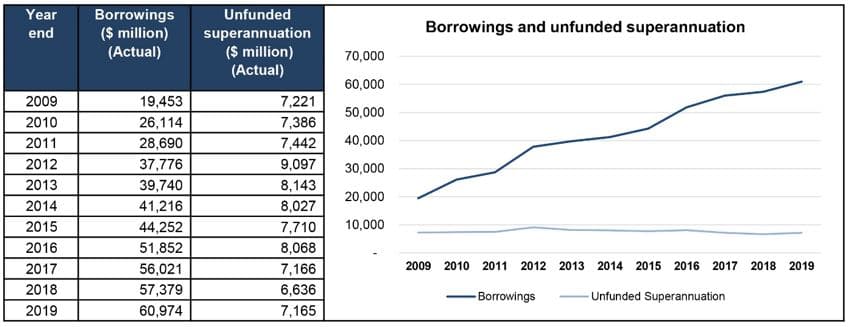
Information on the State’s debt is contained in the ARSF. Borrowings and the State’s unfunded superannuation are significant components of this debt. The increase in 2018-19 was mainly due to a $3.6 billion increase in borrowings.
Source: Tabled Annual Report on State Finances
Figure 9: Borrowings and unfunded superannuation from 2008-09 to 2018-19
Debt sustainability
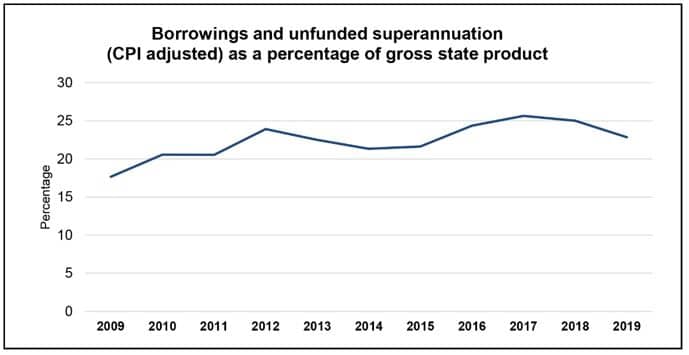
The ARSF contains important information on the State’s net debt. Figure 10 reports another commonly used high level indicator relating to debt, the ‘debt sustainability’ ratio. In this graph, the debt sustainability ratio is the value of borrowings and unfunded superannuation liability of the total public sector as a percentage of gross state product (GSP).
It should be noted that measuring sustainable debt is difficult as the ability to pay debts involves factors such as economic growth, interest rates and the capacity of the State to generate surpluses in the future. As debt is repaid over a long period, these factors cannot be forecast reliably.
Source: Tabled Annual Report on State Finances and Australian Bureau of Statistics
Figure 10: Borrowings and unfunded superannuation as a percentage of GSP
Note: As ABS data for 2018-19 is not yet available, 2018-19 is based on a Treasury estimate of GSP.
Total borrowings and expense commitments
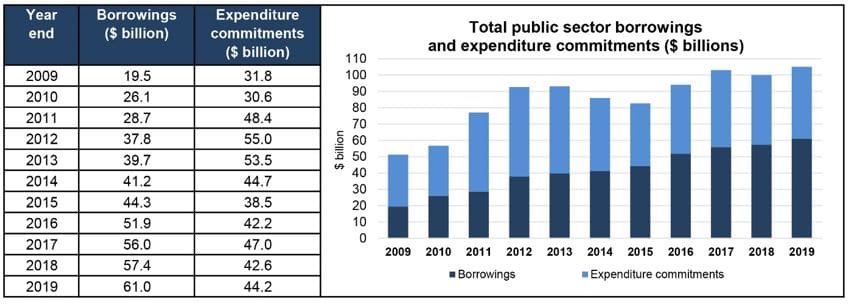
Figure 11 shows the trend in the State’s borrowings and commitment to future expenditure. Overall this year, total public sector borrowing increased by $3.6 billion while expenditure commitments increased by $1.6 billion, resulting in a combined total increase of $5.2 billion.
Source: Tabled Annual Report on State Finances
Figure 11: Total Public Sector borrowings and commitments 2008-09 to 2018-19
Expenditure commitments at 30 June 2019 include $38.5 billion for long-term contracts with private sector contractors for providing health services, and rail and bus operations. Capital expenditure commitments account for $3.6 billion including road infrastructure, schools, health campuses, housing, waste and waste water projects, power transmission and distribution as well as information technology.
Current trend in leave liability balances
The total public sector annual and long service leave liability owing to employees showed an increasing trend, with an additional $171 million taking the balance to $3.1 billion at year end.

Source: Tabled Annual Report on State Finances
Figure 12: WA public sector annual and long service leave liabilities 2008-09 to 2018-19
Management at entities need to proactively manage their leave liabilities. It is important for staff to take regular leave for their health and wellbeing, and for the entity to develop staff to perform the tasks of others. It should also be noted that fraud can be more easily concealed by staff who do not take leave.